Examined life #
The unexamined life is not worth living. – Socrates.
Examined Life is a project I have been thinking about for a long time. I’ve actually usually referred to it as “observed life” because I had the quote wrong in my head. I have been collecting data daily for over seven hundred days in my “master tracker” spreadsheet.
Thoughts on self-tracking #
There’s something that people talk about on the Internet called the “Quantified Self” movement, which consists of people who track multiple personal metrics in order to optimise parts of themselves or their lives.
I try to remember the dual pillars of self-discipline and self-kindness, influenced also by the general stoic principle of focussing attention and efforts on and only on things directly within our personal control. The implementation and improvement of this philosophy is greatly improved by a small measure of self-tracking, in the tradition of Socrates.
Aside from a smartwatch which I wear every day to track my steps, heart rate, workouts and make sure I am not sitting down too much, I also track
- sleep (sleep time, wake time, sleep quality)
- diet (a rough diary of what I ate rather than full-on calorie-counting which I find a little harsh)
- alcohol and caffeine
- time spent at work and working on various personal projects
- my mood throughout the day (a simple 1-10 scale, which I’m currently considering converting to a simpler 1-5 “star” system because I think the 1-10 measurements can be a little meaningless in comparison to each other).
Aside from my interpersonal relationships, these are the things (exercise, sleep, food, alcohol, caffeine and productive time) I have determined have the most direct influence on my day-to-day mood, productivity and contentment. So this simple tracking regime, which just serves as a daily check and is not something I religiously fret about every second of the day, lets me see the connections between all of these different variables and my general mood. Self-kindness is very difficult without the positive feedback of achievement that comes as a result of self-discipline, and self-discipline and achievement is very difficult if you’re stuck in a hole of self-loathing or low motivation. The tracking helps to calibrate these two things and informs the deep connection between them. Combining this simple tracking regime with a journal which I spend about ten minutes writing every morning, summarising the events and my thoughts and feelings from the previous day, has been very insightful for me.
There’s a question of balance here. I’ve seen people dig very deep into the quantified self rabbit hole, developing serious personal infrastructures to allow them to track in very fine detail all sorts of metrics about their lives. I think like anything, there is the danger of becoming obsessive around this subject, and since it deeply depends on technology, it can sometimes create more distractions rather than help to understand how to focus and clear your mind of anxiety and distraction. I currently track everything on my computer in a simple spreadsheet and write my journal in iAWriter, but am seriously considering “going analog” and using a simple notebook, to make this daily ritual a more tactile one. There’s also something about the physical movement of pen on paper which for me at least commits things more fully to memory. But this question of balance and incorporation of self-tracking into my life in an unobtrusive way is very important, and is made easier by keeping in mind the fact that the tracking is there to serve me, I am not a slave to it, and wherever it is not helping, or needs to help more, it is entirely within my control to improve it.
Plots from 2019-20 #
I’ve always been drawn to the quote above, usually attributed to Socrates. The original meaning of the quote is to emphasise the need for a personal philosophy, a way of thinking about yourself, that uses reflection to build a better future self through reference to and critique of the past self. Today, the quote brings to my mind the quantified self movement, a group of people who are devoted to the idea of collecting information about themselves, reviewing it and drawing insights from it to improve, or at the very least understand, their lives.
I’m not sure what Socrates would have to say about this modern “data-driven” philosophy, but I have become more and more drawn to the idea over the past couple of years. I thought it might be interesting to share some of the things I’ve noticed over the last five hundred days about myself, in the hope that this might inspire others to consider paying closer attention to their lives. There’s another reason for sharing too: I think there is a certain aesthetic value inherent in the topology of life one can see writ in the charts, the moving of a line along the page tracing some weird average of the thousands of variables that make up a day in anyone’s life that nonetheless contains some sort of pattern.
Sleep #
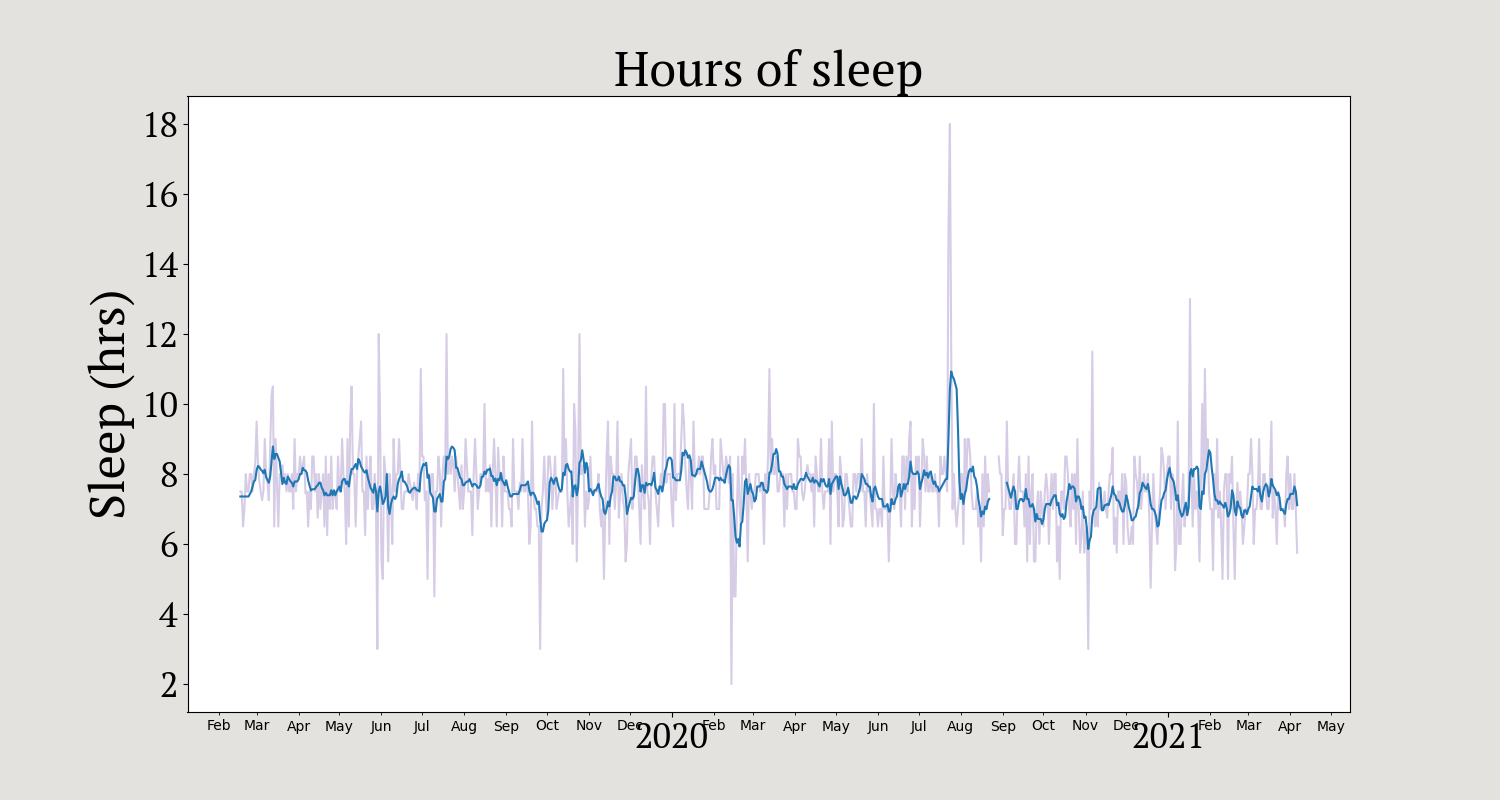
The older I become the more convinced I am that sleep is one of the most important, perhaps the single most important, factor in remaining balanced, peaceful and energetic throughout the day. The chart below shows the hours I slept every night, together with a moving 7-day average, over the last five hundred days. I don’t use any fancy sleep trackers, I just write down in a spreadsheet every morning how many hours I slept the previous night.

There are several periods of my life which are clearly visible on this graph. The most striking is the birth of my son, in February this year, following which there were understandably a few weeks of very little sleep. There are periods of greatly increased variation around holidays I took. And at the beginning of the COVID-19 lockdown I used the time I saved not commuting to and from work every day to catch up on some of that sleep I lost in February.
Alcohol #
The quantified self movement is convinced that sleep, alcohol, other drugs and caffeine (in that order usually) have the biggest overall impact on mood and general contentment in life. I track all of these metrics, and when I looked at the plots I generated I wondered whether I really wanted to share the graph below, in which a black bar represents a day on which I consumed alcohol over the last five hundred days.

It’s pretty clear from the graph above that I drink a bit too frequently (I thought about colouring the bars by the number of drinks, which I also track but ultimately went for the simpler version). It’s usually only a glass or wine or a beer with dinner. I also notice the correlation between consecutive drinking days and stressful periods in my life.
Work #
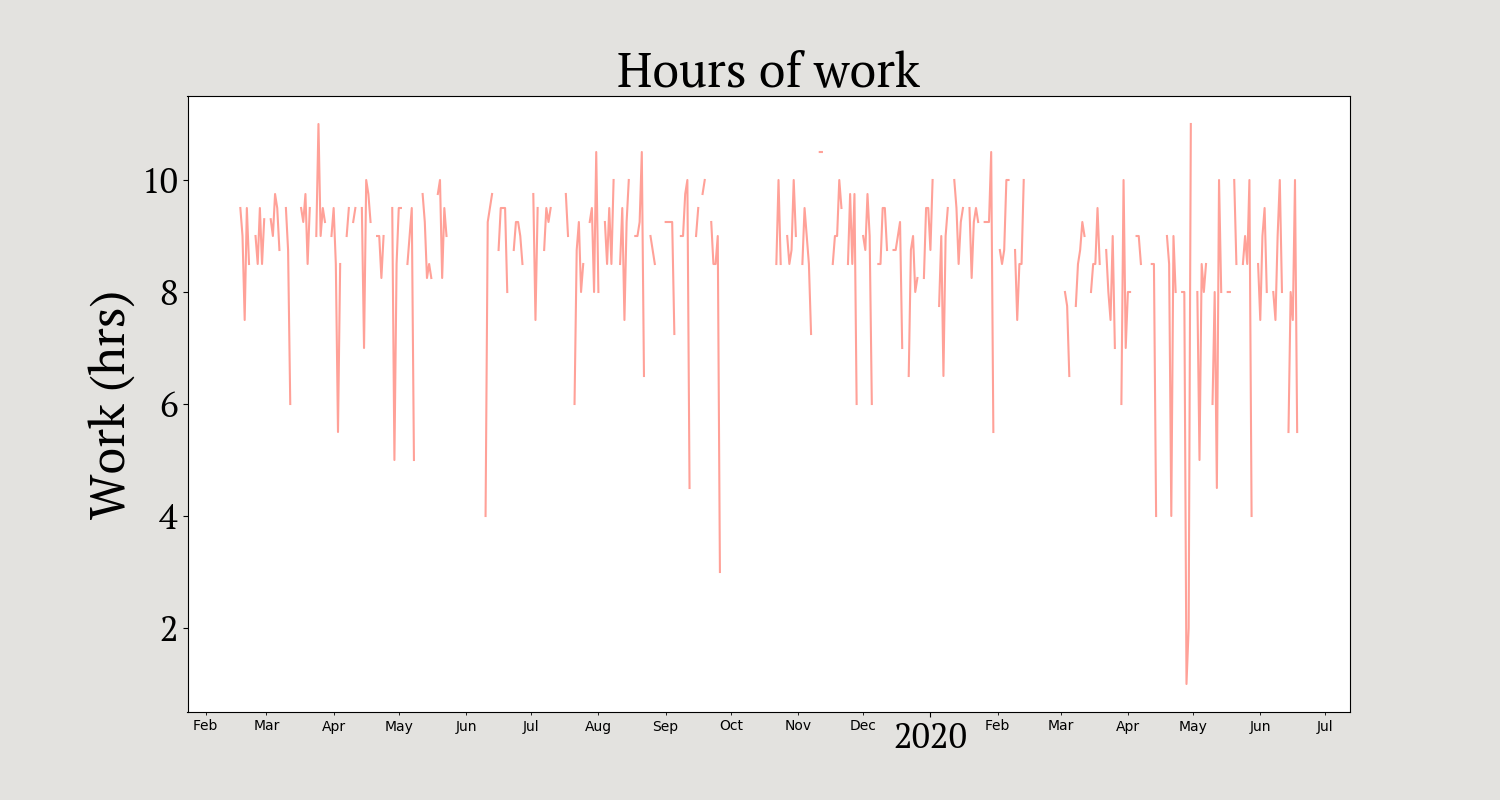
While I was writing about COVID-19 I was looking for a metric that shows a visible effect of the COVID-19 lockdown and the best one I could find is of my daily working hours (these are the hours between the time I count myself as starting work and the time I count myself as finishing, so they include time like lunchbreaks, coffee and chatting in the office when I wasn’t strictly-speaking “working”. I use Rescuetime to track actual bum-in-seat computer time at work but I think that’s a less interesting chart).

I like the healthy amounts of vacation time, and on second thoughts I think the effect visible from February (after my return from a too-short paternity leave) is probably more to do with being a first-time parent than the lockdown per se.
Anxiety #
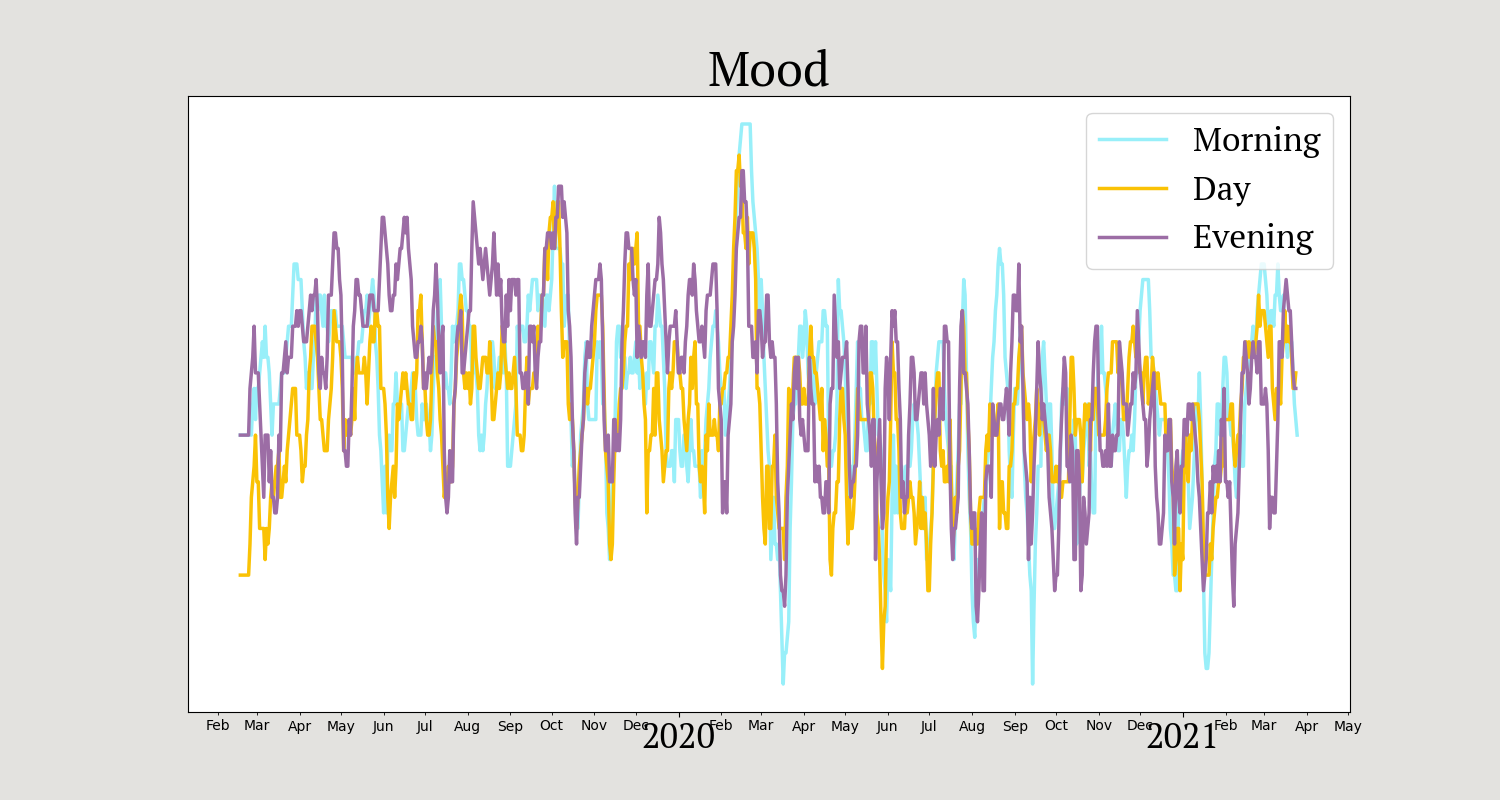
The holy grail of self-tracking, of the self-reflective data scientist, is an answer to the question “am I happy” based on actual data from your life. For me the answer to the question “am I happy” on a day-to-day basis can be approximated with the answer to the question “how anxious am I feeling today”, and to that end I tried my best to track my general mood and feeling of contentment (10) or anxiety (0) at three points throughout the last five hundred days.

Notwithstanding the concerns about the accuracy of the data the way I collected it (upon reflection the morning after, all three data points for the previous day at the same time, and with vague definitions of the cutoffs between the three sections of the day) this is a really interesting graph to look at over a timescale like this. My favourite feature of the graph is the easily visible section in June 2019 where my evening mood is vastly better than my day and morning mood; this is because I was on holiday with my friends and in the days recovering from the hangovers caused by the evenings. There’s also the rise to almost universal happiness around the birth of my son and the accompanying few weeks of time at home, before the uncertainty and panic around COVID-19 in mid-March put an end to that.
Of course, none of this means anything if you don’t have the ability and the drive to actually act on the things you observe. That’s the next step for me, to try and improve the metrics in these graphs over time, to use my synthesised understanding of my past to influence the topology of these graphs in the future. Maybe that’s just a long-winded way of saying “examining yourself”: looking at yourself critically and trying to do better, or at the very least understand when you could do better and why you didn’t. I hope this post will go some way to making me accountable to myself, and hope to revisit these metrics and whichever new ones I start collecting throughout my life once a year to see how things are going.
Code to generate plots #
import re
import numpy as np
import pandas as pd
import matplotlib, numpy
matplotlib.use('Agg')
import matplotlib.pyplot as plt
import datetime as dt
import matplotlib.dates as mdates
fig, ax = plt.subplots(figsize=(15,8))
data = pd.read_csv('/Users/clinton/Documents/personal/master-tracker/MT-life.csv')
sleep_dur = list(data.sleep_duration[1:-3])
sleep_dur = [re.sub(r'(\d)h\s(\d\d)m', lambda m: str(float(m.groups()[0]) + float(m.groups()[1])/60.0) ,str(x)) for x in sleep_dur]
sleep_dur = [re.sub(r'(\d)h',lambda m: str(float(m.groups()[0])) ,x) for x in sleep_dur]
sleep_dur = [x.replace('*','') for x in sleep_dur]
sleep_dur = [float(x) for x in sleep_dur]
date_range = [dt.datetime(2019, 2, 17) + dt.timedelta(days=i) for i in range(len(sleep_dur))]
years = mdates.YearLocator()   # every year
months = mdates.MonthLocator()  # every month
years_fmt = mdates.DateFormatter('%Y')
months_fmt = mdates.DateFormatter('%b')
hcsfont = {'fontname':'PT Serif'}
ax.xaxis.set_major_locator(years)
ax.xaxis.set_major_formatter(years_fmt)
ax.xaxis.set_minor_locator(months)
ax.xaxis.set_minor_formatter(months_fmt)
plt.plot(date_range, sleep_dur, color='xkcd:indigo', alpha=0.2)
window_size = 7
moving_averages = []
i = 0
while i < len(sleep_dur) - window_size + 1:
    this_window = sleep_dur[i : i + window_size]
    window_average = sum(this_window) / window_size
    moving_averages.append(window_average)
    i += 1
moving_averages = [moving_averages[0]]*6 + moving_averages
plt.plot(date_range, moving_averages)
for tick in ax.get_xticklabels():
    tick.set_fontname("PT Serif")
    tick.set_fontsize(25)
for tick in ax.get_yticklabels():
    tick.set_fontname("PT Serif")
    tick.set_fontsize(25)
# plt.ylabel('Sleep (hrs)', **csfont, fontsize=14)
ax.set_ylabel("Sleep (hrs)", fontname="PT Serif", fontsize=35)
plt.title('Hours of sleep', csfont, fontsize=35)
plt.rcParams['savefig.facecolor']='#E3E2DF'
#e3e2df
plt.savefig('sleep_dur.png')
return 'sleep_dur.png'
import re
import numpy as np
import pandas as pd
import matplotlib, numpy
matplotlib.use('Agg')
import matplotlib.pyplot as plt
import datetime as dt
import matplotlib.dates as mdates
from matplotlib import cm
from matplotlib.colors import LinearSegmentedColormap
fig, ax = plt.subplots(figsize=(10,2))
data = pd.read_csv('/Users/clinton/Documents/personal/master-tracker/MT-life.csv')
cdict = {'red':   [(0.0, 1.0, 1.0),  # red decreases
		 (1.0, 0.0, 0.0)],

       'green': [(0.0, 0.0, 0.0),  # green increases
		 (1.0, 1.0, 1.0)],

       'blue':  [(0.0, 0.0, 0.0),  # no blue at all
		 (1.0, 0.0, 0.0)]}

red_green_cm = LinearSegmentedColormap('RedGreen', cdict, 10000)
colors = cm.get_cmap(red_green_cm, 10000)
x = np.array([data['marijuana'].iloc[i] > 0 for i in range(len(data))])
date_range = [dt.datetime(2019, 2, 17) + dt.timedelta(days=i) for i in range(len(x))]
years = mdates.YearLocator()   # every year
months = mdates.MonthLocator()  # every month
years_fmt = mdates.DateFormatter('%Y')
months_fmt = mdates.DateFormatter('%b')
csfont = {'fontname':'PT Serif'}
ax.xaxis.set_major_locator(years)
ax.xaxis.set_major_formatter(years_fmt)
ax.xaxis.set_minor_locator(months)
ax.xaxis.set_minor_formatter(months_fmt)
csfont = {'fontname':'PT Serif'}
barprops = dict(aspect='auto', cmap='binary', interpolation='nearest')
#  ax2 = fig.add_axes([0.3, 0.4, 0.6, 0.2])
# ax2.set_axis_off()
for tick in ax.get_xticklabels():
    tick.set_fontname("PT Serif")
    tick.set_fontsize(25)
for tick in ax.get_yticklabels():
    tick.set_fontname("PT Serif")
    tick.set_fontsize(25)
plt.yticks([])
ax.imshow(x.reshape((1, -1)), **barprops)
plt.rcParams['savefig.facecolor']='#E3E2DF'
plt.savefig('alcohol.png')
return 'alcohol.png'
import pandas as pd
import numpy as np
import matplotlib, numpy
matplotlib.use('Agg')
import matplotlib.pyplot as plt
fig=plt.figure(figsize=(10,6))
data = pd.read_csv('/Users/clinton/Documents/personal/master-tracker/MT-life.csv')
#  plt.plot(data.index, data.mood_morning, color='xkcd:blue', alpha=0.4, label='Morning')
#  plt.plot(data.index, data.mood_day, color='xkcd:salmon', alpha=0.4, label='Day')
plt.plot(data.index, data.work_duration.replace('-','0'), color='xkcd:green', alpha=0.4, label='Evening')
#plt.ylim(70,85)
fig.tight_layout()
plt.legend()
plt.savefig('python-matplot-fig.png')
return 'python-matplot-fig.png' # return filename to org-mode
import re
import numpy as np
import pandas as pd
import matplotlib, numpy
matplotlib.use('Agg')
import matplotlib.pyplot as plt
import datetime as dt
import matplotlib.dates as mdates
fig, ax = plt.subplots(figsize=(15,8))
data = pd.read_csv('/Users/clinton/Documents/personal/master-tracker/MT-life.csv')
work_dur = list(data.work_duration[1:-3])
work_dur = [re.sub(r'(\d)h\s(\d\d)m',lambda m: str(float(m.groups()[0]) + float(m.groups()[1])/60.0),str(x)) for x in work_dur]
work_dur = [re.sub(r'(\d)h',lambda m: str(float(m.groups()[0])) ,x) for x in work_dur]
work_dur = [x.replace('*','0') for x in work_dur]
work_dur = [x.replace('-','0') for x in work_dur]
work_dur = [x.replace('010d 15.25','8.75') for x in work_dur]
work_dur = [x.replace('010d 15.0','9') for x in work_dur]
work_dur = [x.replace('010d 14.75','9.25') for x in work_dur]
work_dur = [x.replace('010d 17.0','7') for x in work_dur]
work_dur = [float(x) for x in work_dur]
work_dur[0] = 9.5
cons_nulls = []
j = 0
is_currently_null = False
for i in range(len(work_dur)):
    if work_dur[i] == 0.0:
	is_currently_null = True
    else:
	is_currently_null = False
    if is_currently_null:
	j += 1
    else:
	j = 0
    cons_nulls.append(j)
work_dur = [np.nan if x == 0 else x for x in work_dur]
date_range = [dt.datetime(2019, 2, 17) + dt.timedelta(days=i) for i in range(len(work_dur))]
years = mdates.YearLocator()   # every year
months = mdates.MonthLocator()  # every month
years_fmt = mdates.DateFormatter('%Y')
months_fmt = mdates.DateFormatter('%b')
csfont = {'fontname':'PT Serif'}
ax.xaxis.set_major_locator(years)
ax.xaxis.set_major_formatter(years_fmt)
ax.xaxis.set_minor_locator(months)
ax.xaxis.set_minor_formatter(months_fmt)
plt.plot(date_range, work_dur, color='xkcd:salmon', alpha=0.7, linewidth=2.4)
work_dur = [np.mean(work_dur[(i-2*cons_nulls[i]):(i-cons_nulls[i])]) if x == 0.0 else x for i, x in enumerate(work_dur)]
window_size = 7
moving_averages = []
i = 0
while i < len(work_dur) - window_size + 1:
    this_window = work_dur[i : i + window_size]
    window_average = sum(this_window) / window_size
    moving_averages.append(window_average)
    i += 1
moving_averages = [moving_averages[0]]*6 + moving_averages
plt.plot(date_range, moving_averages)
plt.plot(date_range, nails, color='xkcd:hunter green', alpha=0.2, linewidth=3)
for tick in ax.get_xticklabels():
    tick.set_fontname("PT Serif")
    tick.set_fontsize(25)
for tick in ax.get_yticklabels():
    tick.set_fontname("PT Serif")
    tick.set_fontsize(25)
# plt.ylabel('Sleep (hrs)', **csfont, fontsize=14)
ax.set_ylabel("Work (hrs)", fontname="PT Serif", fontsize=35)
plt.title('Hours of work', **csfont, fontsize=35)
plt.rcParams['savefig.facecolor']='#E3E2DF'
#e3e2df
plt.savefig('work_dur.png')
return 'work_dur.png'
import re
import numpy as np
import pandas as pd
import matplotlib, numpy
matplotlib.use('Agg')
import matplotlib.pyplot as plt
import datetime as dt
import matplotlib.dates as mdates
fig, ax = plt.subplots(figsize=(15,8))
data = pd.read_csv('/Users/clinton/Documents/personal/master-tracker/MT-life.csv')
colours = {'mood_morning': 'xkcd:robin\'s egg blue', 'mood_day': 'xkcd:Goldenrod', 'mood_evening': 'xkcd:dark lilac'}
labels = {'mood_morning': 'Morning', 'mood_day': 'Day', 'mood_evening': 'Evening'}
for col in ['mood_morning', 'mood_day', 'mood_evening']:
    nails = data[~data[col].isna()][col]
    date_range = [dt.datetime(2019, 2, 17) + dt.timedelta(days=i) for i in range(len(nails))]
    years = mdates.YearLocator()   # every year
    months = mdates.MonthLocator()  # every month
    years_fmt = mdates.DateFormatter('%Y')
    months_fmt = mdates.DateFormatter('%b')
    csfont = {'fontname':'PT Serif'}
    ax.xaxis.set_major_locator(years)
    ax.xaxis.set_major_formatter(years_fmt)
    ax.xaxis.set_minor_locator(months)
    ax.xaxis.set_minor_formatter(months_fmt)
    plt.yticks([])
    for tick in ax.get_xticklabels():
	tick.set_fontname("PT Serif")
	tick.set_fontsize(25)
    # plt.ylabel('Sleep (hrs)', **csfont, fontsize=14)
    window_size = 7
    moving_averages = []
    i = 0
    while i < len(nails) - window_size + 1:
	this_window = nails[i : i + window_size]
	window_average = sum(this_window) / window_size
	moving_averages.append(window_average)
	i += 1
    moving_averages = [moving_averages[0]]*6 + moving_averages
    plt.plot(date_range, moving_averages, color=colours[col], label=labels[col], linewidth=2.5)
plt.title('Mood', **csfont, fontsize=35)
import matplotlib.font_manager as font_manager
font = font_manager.FontProperties(family='PT Serif',
				 weight='normal',
				 style='normal', size=24)
plt.legend(prop=font)
plt.rcParams['savefig.facecolor']='#E3E2DF'
#e3e2df
plt.savefig('mood.png')
return 'mood.png'
import re
import numpy as np
import pandas as pd
import matplotlib, numpy
matplotlib.use('Agg')
import matplotlib.pyplot as plt
import datetime as dt
import matplotlib.dates as mdates
fig, ax = plt.subplots(figsize=(15,8))
data = pd.read_csv('/Users/clinton/Documents/personal/master-tracker/MT-life.csv')
nails = data[~data.weight.isna()]['weight']
date_range = [dt.datetime(2020, 1, 1) + dt.timedelta(days=i) for i in range(len(nails))]
years = mdates.YearLocator()   # every year
months = mdates.MonthLocator()  # every month
years_fmt = mdates.DateFormatter('%Y')
months_fmt = mdates.DateFormatter('%b')
csfont = {'fontname':'PT Serif'}
ax.xaxis.set_major_locator(years)
ax.xaxis.set_major_formatter(years_fmt)
ax.xaxis.set_minor_locator(months)
ax.xaxis.set_minor_formatter(months_fmt)
plt.plot(date_range, nails, color='xkcd:hunter green', alpha=0.2, linewidth=5)
plt.yticks([])
for tick in ax.get_xticklabels():
    tick.set_fontname("PT Serif")
    tick.set_fontsize(25)
# plt.ylabel('Sleep (hrs)', **csfont, fontsize=14)
plt.title('Fingernails', **csfont, fontsize=35)
plt.rcParams['savefig.facecolor']='#E3E2DF'
#e3e2df
plt.savefig('exercise.png')
return 'exercise.png'
Links and articles #
- This insanely detailed post by Stephen Wolfram about his home setup and technologies he uses to work.
- Orger, an interesting package that generates org-mode files from various different tracking sources that can be input into org-based workflows.
- Kevin Klein’s life monitor based on a bunch of different data, all automated.
- timeline, a really nice project that lets you input all sorts of data from your life into a timeline with a simple web UI.
- A very well-written piece about the collapse of self-worth in the digital age.